Product analytics links what customers do in your product to the results you want to achieve. It helps you see whether your work is delivering the outcomes you planned — from adoption of new features to longer-term retention.
Used well, analytics becomes a way to guide decisions at every level of product planning:
Validate strategy: Check that your strategy and goals reflect actual customer behavior. For example, you can compare engagement across features to see which areas support your strategic themes and which fall short.
Prioritize effectively: Use data to determine where improvements will be the most useful — whether that means refining a core workflow or investing in a capability customers rely on heavily.
Measure progress: Track ongoing indicators of success (such as active use, renewal rates, and satisfaction) to see how customer behavior changes over time.
Related:
Top
Which teams use product analytics?
Product analytics connects every team to the same truth about product performance. Product managers rely on it most, but other groups use this data to understand how customers experience the product and where improvements will make the biggest difference.
Customer support | Uses analytics to monitor engagement and guide customer conversations. The data helps support teams show customers how to use features more efficiently and discover new functionality. |
Engineering | Looks for areas of friction. Usage data helps engineers prioritize fixes and technical improvements based on real user behavior. |
Executive team | Track whether product performance aligns with business goals. Metrics such as retention, adoption, and revenue act as leading indicators of overall success. |
Product management | Uses analytics to inform the roadmap — from strategy to fe. Data reveals how customers interact with the product and highlights opportunities to deliver more value. |
Product marketing | Studies engagement patterns to understand key segments and messaging. Insights from usage data help refine campaigns and reach the right audiences. |
UX and design | Measure how design choices influence user behavior. Clicks, page views, and task completion rates reveal whether desired outcomes are being met and where the experience can improve. |
Top
What is the difference between product analytics and product metrics?
Analytics vs. metrics — the same thing? It sure sounds like they could be. And no one is likely to correct you if you mistake the terms. But if we are being precise here (and we like to be), here is how you can parse meaning:
Example: Tracking how many users sign up for a free trial is a metric. Discovering that those who use a specific feature convert faster is analytics.
The metrics you include will depend on your product goals, company size, and industry. In general, product metrics fall into four categories:
Business metrics: Measure company performance, such as revenue or growth rate
Product usage metrics: Show how people interact with your product, including activity frequency and feature adoption
Customer satisfaction: Reflect how customers feel about their experience through data like NPS or customer effort scores
Roadmap progress: Track how the product team delivers against planned releases and initiatives
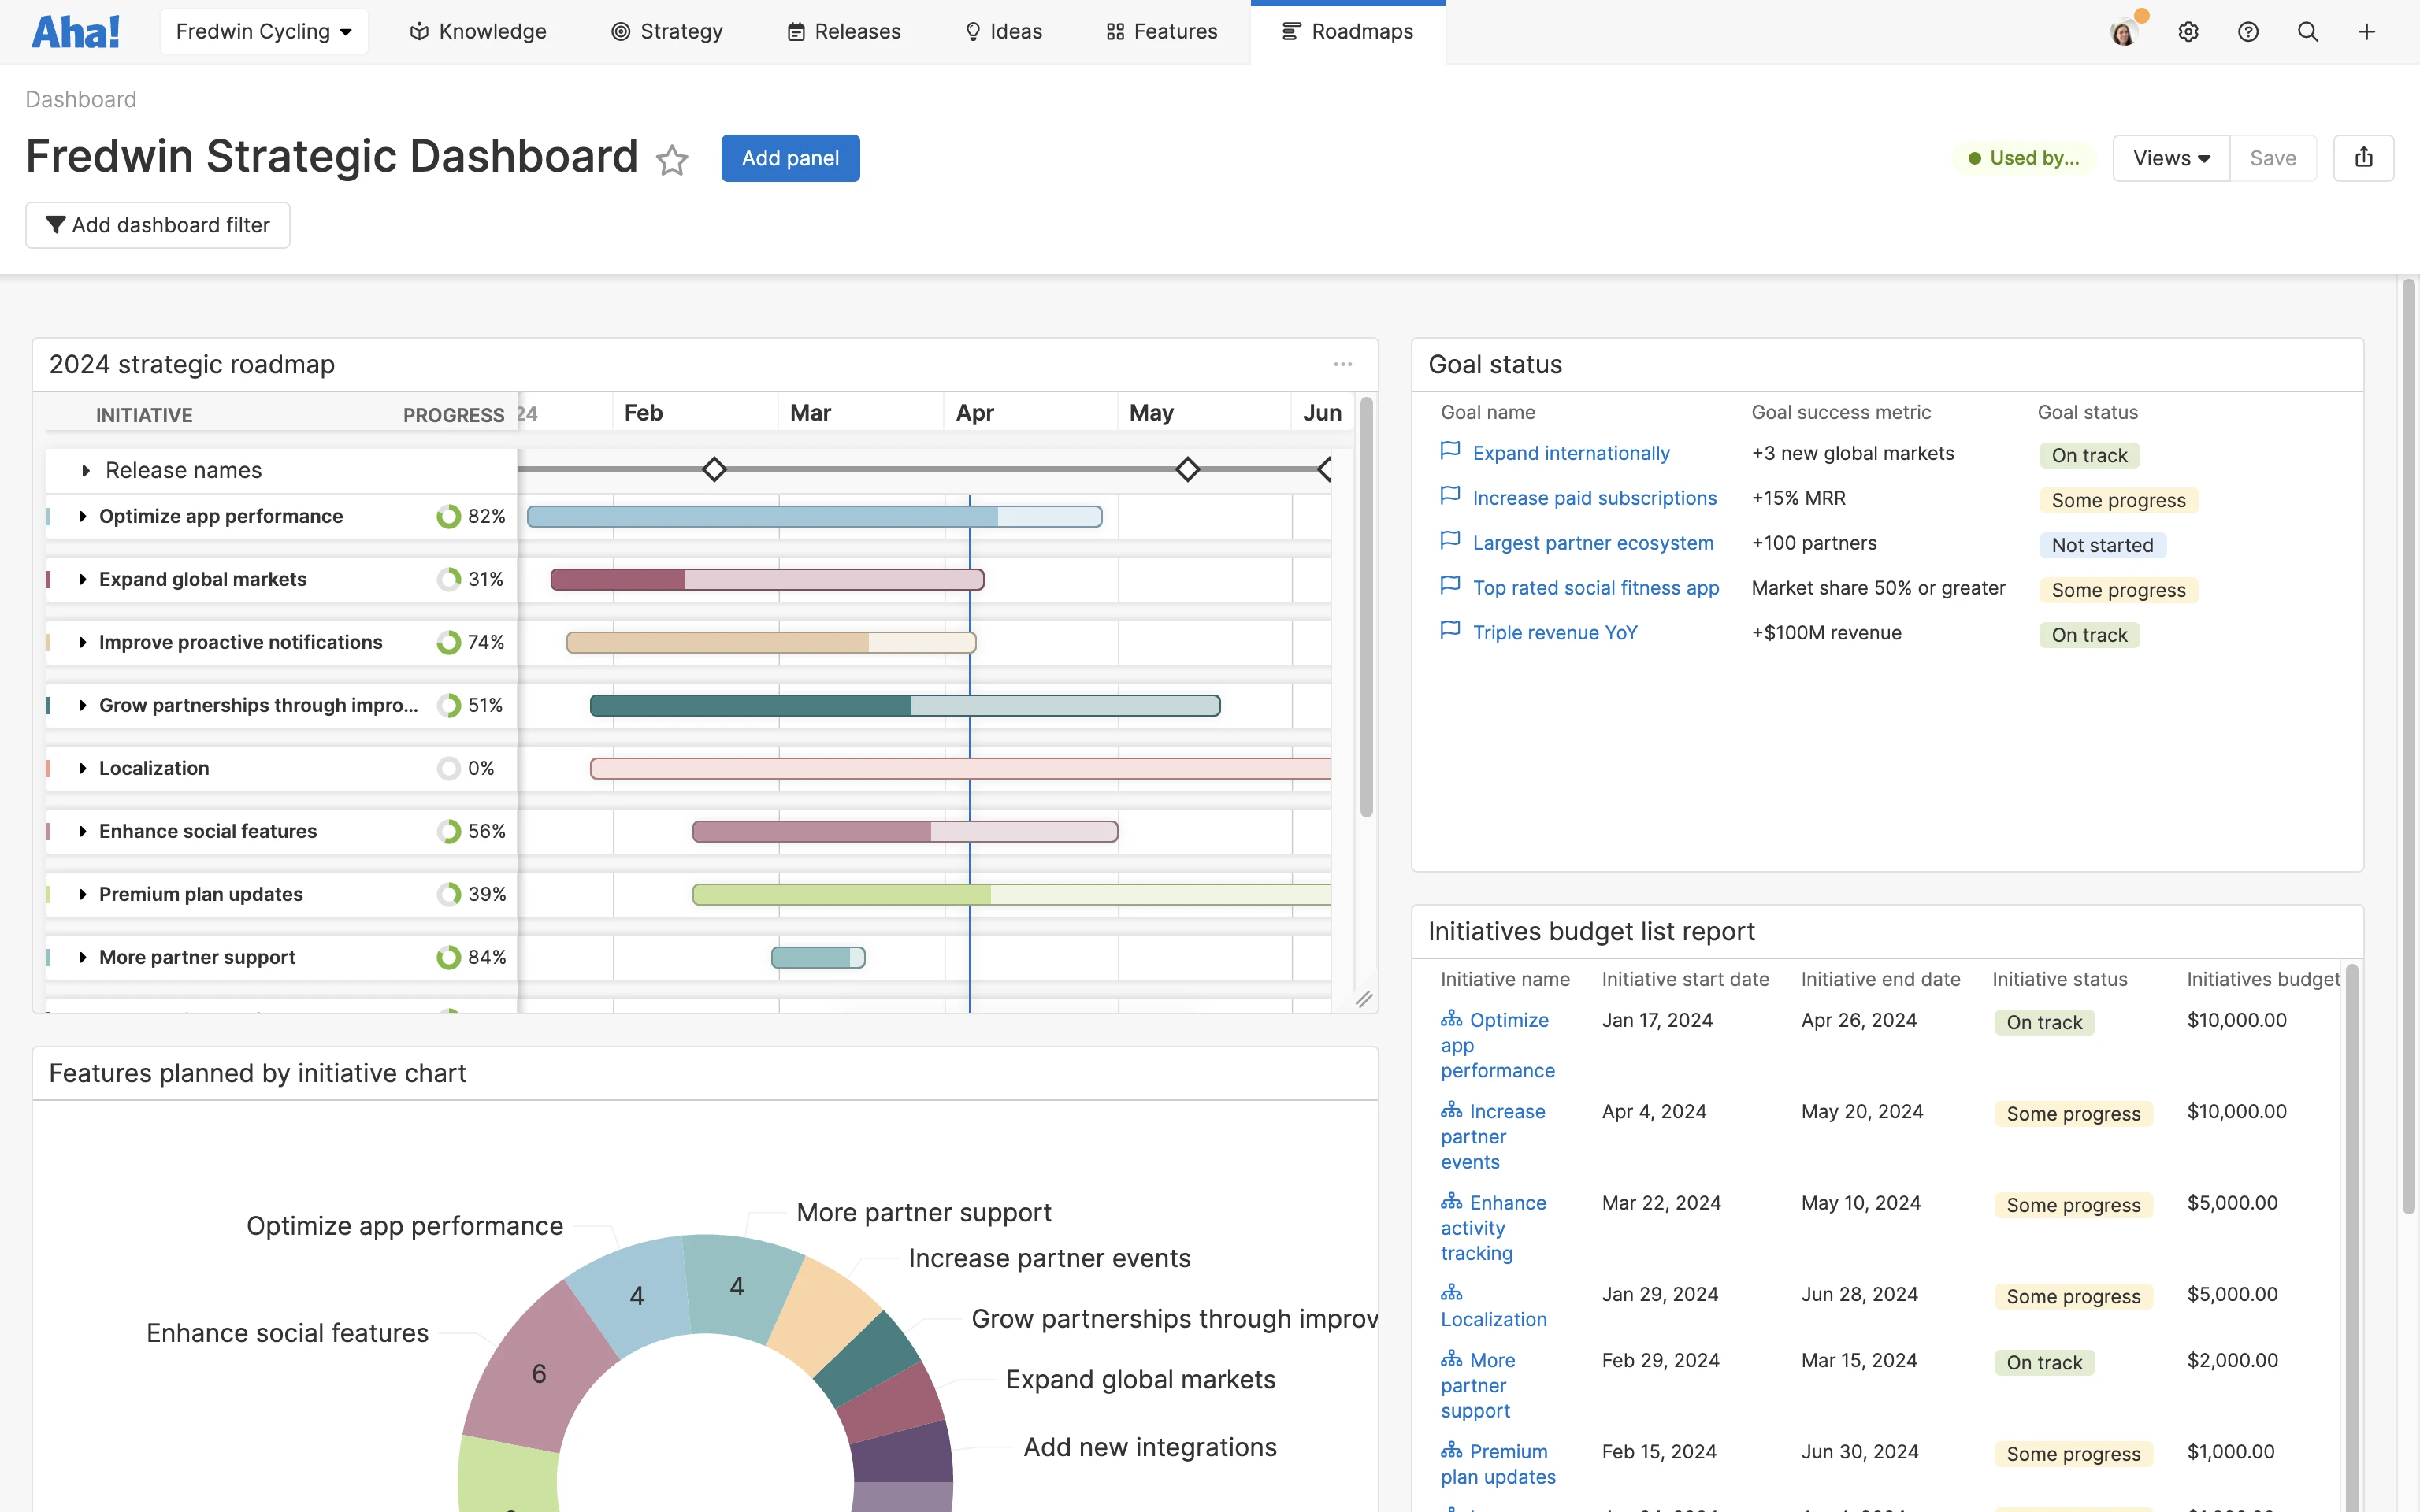
Building a consolidated view of these data points helps you evaluate progress and spot trends over time.
The example below shows a product performance dashboard in Aha! Roadmaps — focused on progress toward strategic goals and delivery against the roadmap.
With Aha! software, you can report on nearly every data element in your account and tailor your dashboard to include the exact information you need.
Related:
Top
Is product analytics the same as marketing analytics?
Both product and marketing teams use data to measure engagement, but they focus on different parts of the customer journey.
Product analytics looks at in-product behavior — how people use your product once they have signed up or purchased.
Marketing analytics measures pre-conversion engagement — how people discover, evaluate, and decide to try your product.
Used together, these perspectives give you a complete view of growth, from initial awareness through long-term adoption.
Product analytics | Marketing analytics |
Tracks user actions inside the product | Tracks engagement with campaigns and channels |
Helps improve onboarding, retention, and feature adoption | Helps improve reach, conversion, and message alignment |
Focuses on existing customers and usage patterns | Focuses on prospects and lead generation3 |
Both functions share common goals: increasing revenue and sustaining growth, for example. When each team understands the other’s metrics, you can coordinate more effectively and ensure a seamless experience from first touch to long-term use.
Top
Imagine you just launched a new customer onboarding flow. Product analytics can show which steps users complete, where they stall, and how that affects activation rates. This helps you understand what is working and where people lose momentum.
Product analytics tools capture data by tracking user actions within your product or website — such as clicks, pageviews, and signups. They then analyze that activity to reveal patterns in customer behavior. Common types of analysis include:
Attribution analysis: Examines customer touchpoints (e.g., demos, sales conversations, website visits) that lead to a purchase
Churn analysis: Tracks your customer loss rate to identify why customers leave
Cohort analysis: Groups users based on shared characteristics or behaviors to compare engagement over time
Conversion analysis: Measures whether customers complete key actions (such as starting a trial) and where they drop off
Funnel analysis: Maps each stage of the customer journey to reveal friction points that prevent progress
Retention analysis: Identifies the features or behaviors that keep customers coming back
Segmentation: Divides users into categories based on demographics, behavior, or role to uncover meaningful trends
Used well, analytics tools do more than report data. They help teams learn from every release and make steady, informed improvements to the product experience.
Related:
Top
You do not need massive amounts of data to begin using product analytics. The best time to invest is as soon as you have a viable product and want to understand how people use it.
As your company grows, the way you use analytics will evolve:
Early stage: Track basic engagement and conversion metrics to see if customers are adopting the product and reaching key milestones.
Growth stage: Expand to include cohort and retention analysis to understand long-term patterns in use and loyalty.
Established stage: Integrate analytics with customer feedback systems and strategic goals to connect day-to-day usage with larger business outcomes.
Regardless of scale, the aim is the same: using data to improve your product and the experience around it. The real value comes from connecting insights to action — not from collecting more data.
Top
How to use product analytics to make better product decisions
Product data is easy to collect, but harder to interpret. Numbers alone cannot tell the full story. If your conversion rate drops, for example, that does not necessarily mean customers have lost interest — they might simply be running into friction during signup or onboarding.
So, how can you figure out what the data is telling you and then act upon it? The key is to start with clear questions and use analytics to guide your understanding of customer behavior. Focus on these four main areas of your product work.
Acquisition: How customers find your offering and sign up
Use funnel and conversion analysis to see how people discover your product and where they drop off before converting. Look at campaign sources, landing pages, and signup flows to identify points of friction or confusion. Analytics can show which channels attract the right audience and how messaging affects trial starts — helping you refine positioning and improve the first impression customers have of your product.
Activation: What drives the user to their first valuable moment
Measure the steps users take after signing up and track how quickly they reach meaningful engagement. Feature usage, task completion rates, and onboarding flow completion can all reveal whether people are realizing early value. If activation rates are low, dig deeper into the experience. Are key features discoverable? Does onboarding explain the product's core benefits? Product analytics highlights the moments that determine early success.
Retention: What keeps customers coming back
Track active use, login frequency, and engagement with essential features. Cohort and retention analyses show how long users stay active and which behaviors predict long-term success. Combine this with customer feedback to understand the "why" behind patterns. For instance, customers who consistently use collaboration features might do so because those capabilities fit into their daily workflow — an insight that can inform future investment.
Analytics is not limited to customer behavior. Product teams can use it to assess internal progress — monitoring release cadence, roadmap completion, and quality trends over time. This helps you see whether the team is working efficiently and if planned initiatives are translating into meaningful product outcomes. Use these insights to guide prioritization, capacity planning, and conversations about what to build next.
Tip: Avoid overmeasuring
Analytics is a powerful guide, but it can become overwhelming when every decision depends on another test or report. Not every number deserves equal attention, and more data does not always lead to better understanding. If you oversegment customers or fixate on small fluctuations, you risk losing sight of the bigger picture. A slight drop in clicks might not matter if overall adoption is strong. And dismissing feedback from customer conversations just because usage data tells a different story can be equally misleading.
The goal is balance. Product teams build the best outcomes when they combine evidence with judgment and experience.
Related:
Top
Connect data to customer understanding
Product analytics helps you see how people use your product and how their behavior changes after each release. What it cannot tell you is why they act that way. That is where discovery helps.
In Aha! Discovery, you can link usage data to what customers share in interviews and feedback. This context turns data points into understanding. For example, analytics might show that few people use a new feature, and discovery interviews could reveal whether they find it confusing or do not see its value. When you use both together, you make decisions that are informed by evidence and grounded in real experience. You can adjust plans sooner and focus effort where it will have the greatest effect.