See how long work takes with the cycle and lead time report.
Improve future work estimates based on past cycle and lead times


How long will it take to deliver this? You get this question all the time if you lead a delivery team. But even when you have years of experience, estimating timelines can feel uncertain. The good news is that past performance can hold the clues you need to plan future work with more confidence. Today's update gives you a powerful way to view your team's historical delivery data.
Use the improved cycle and lead time report to estimate work more accurately — now available in Aha! Teamwork and Aha! Develop.
If you are not familiar with cycle and lead time, both agile reporting metrics help you understand work's duration. Cycle time shows how long work takes once your team starts it. Lead time measures the full task-management journey — from when a request first enters your backlog until you deliver it. Of course, you could already track these key kanban metrics as part of the Aha! Teamwork Advanced and Aha! Develop Advanced plans. You can now gain even more insight with a fully redesigned report.
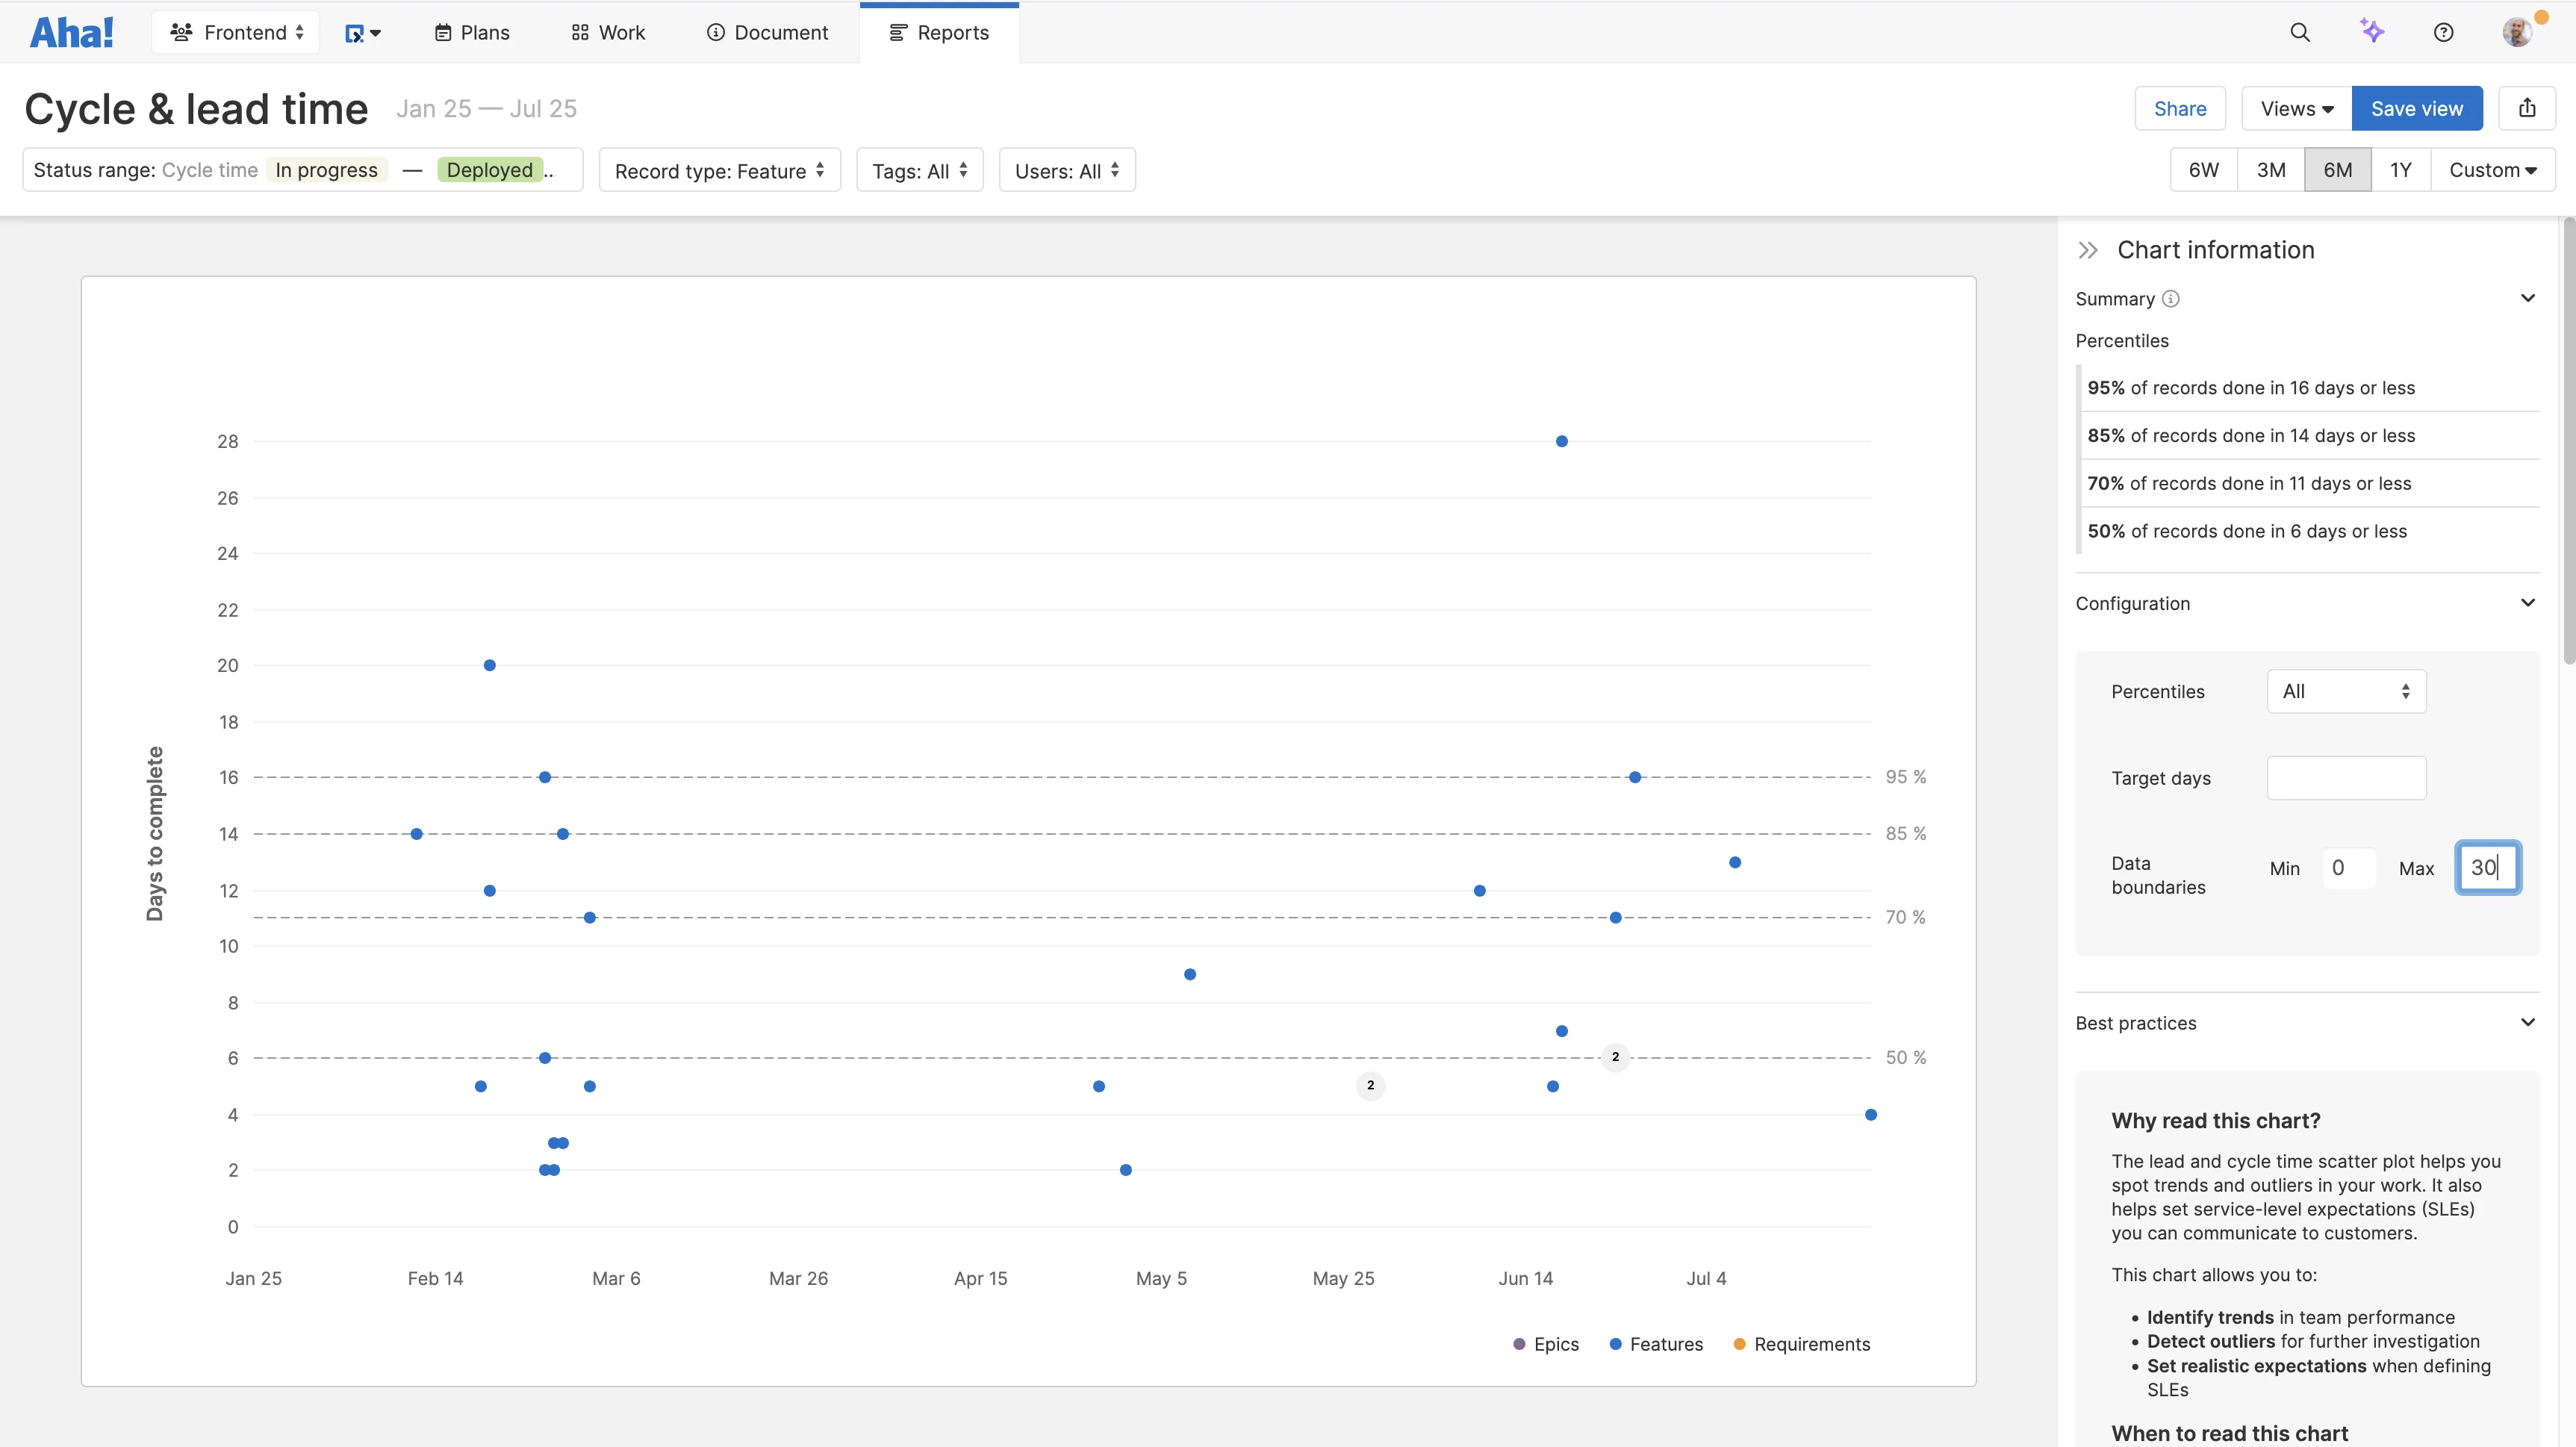
To get started, head to the Reports section of your Team and open the new report. Choose the time period you want to view (such as six weeks or three months). Then, pick Cycle time, Lead time, or a Custom status range. You can also filter by record type (epics, features, or requirements), tags, or user to further focus your analysis.
Individual work items are represented as dots on the chart — plotted by when the work was finished and how long it took. New percentile lines indicate how quickly the team delivers 50%, 70%, 85%, and 95% of work. This helps you understand the range of delivery times that are typical for your team and spot when work falls outside of the norm. You can also set a target cycle or lead time and measure how well your team is tracking against it.
Let's look at a couple of ways you can use the new report:
Set realistic delivery expectations
Predict how long development will take for new product features. In the example below, we filtered the cycle time report for features completed in the past six months. And we excluded outliers beyond 30 days to focus on consistent work patterns. The chart shows that 85% of features were delivered in 14 days or less, and 95% within 16 days. This data gives us complete confidence to set an initial estimate of 16 days per feature during early planning sessions.
Monitor response times
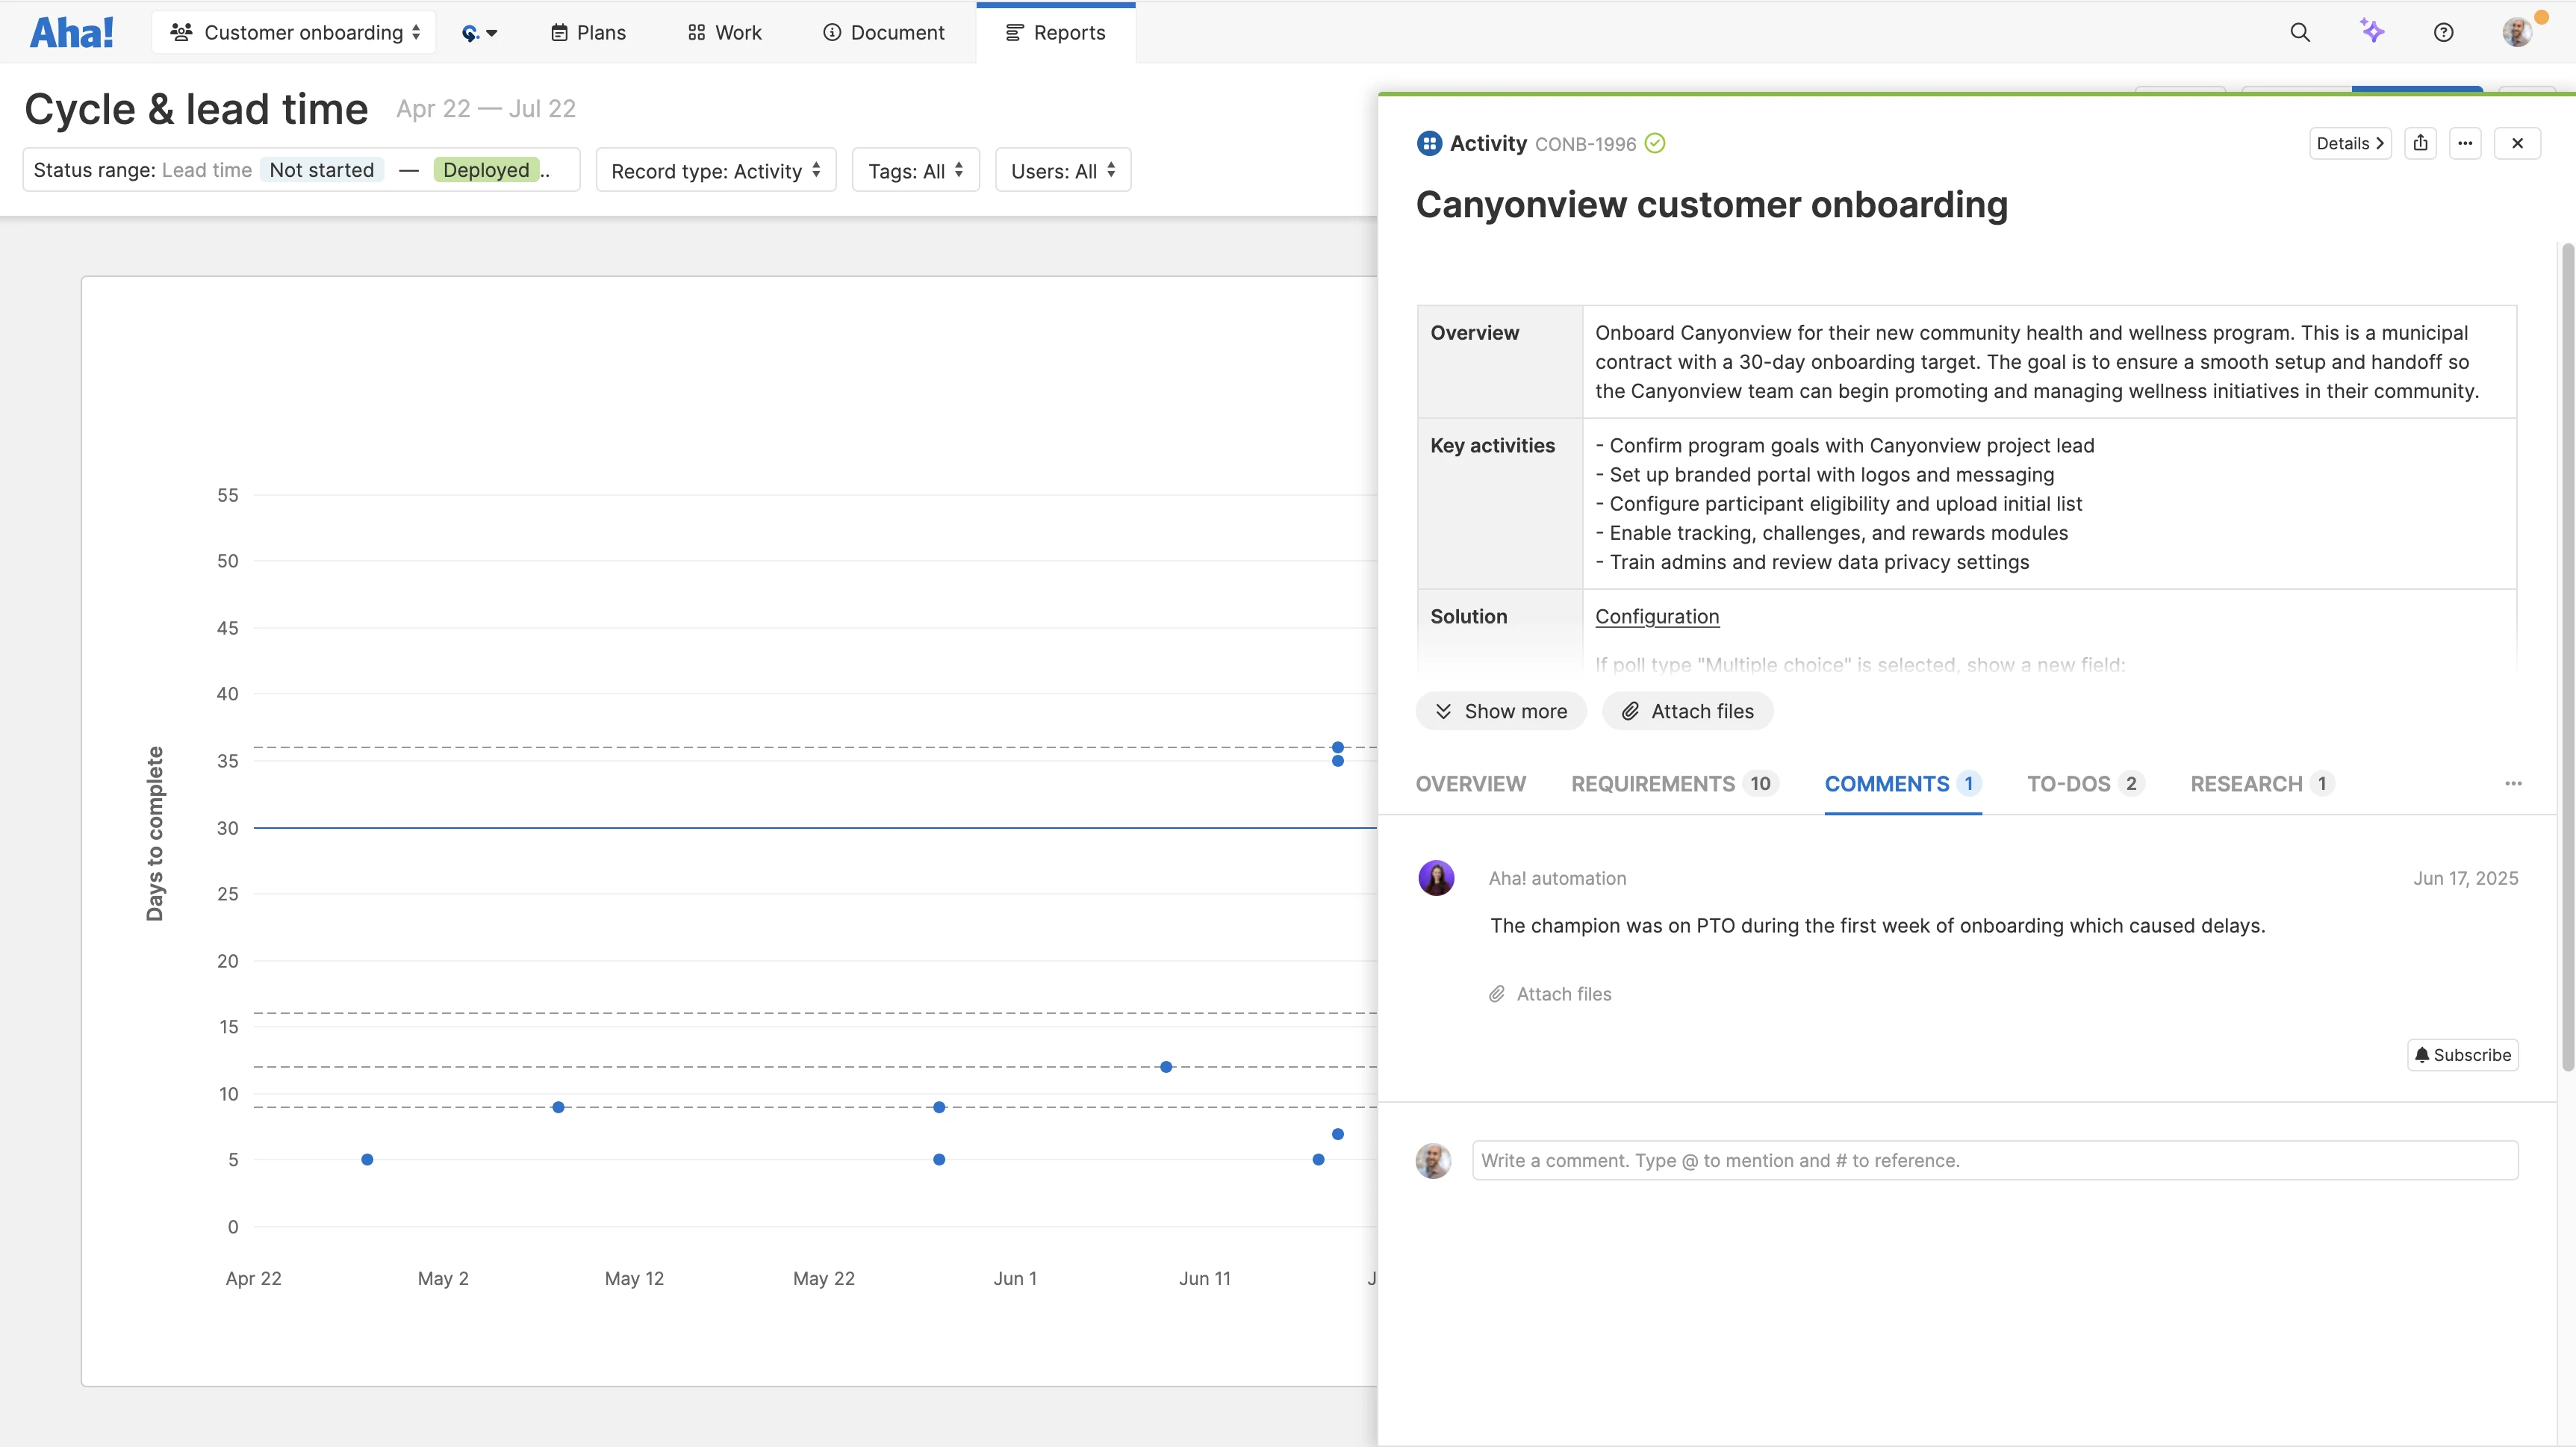
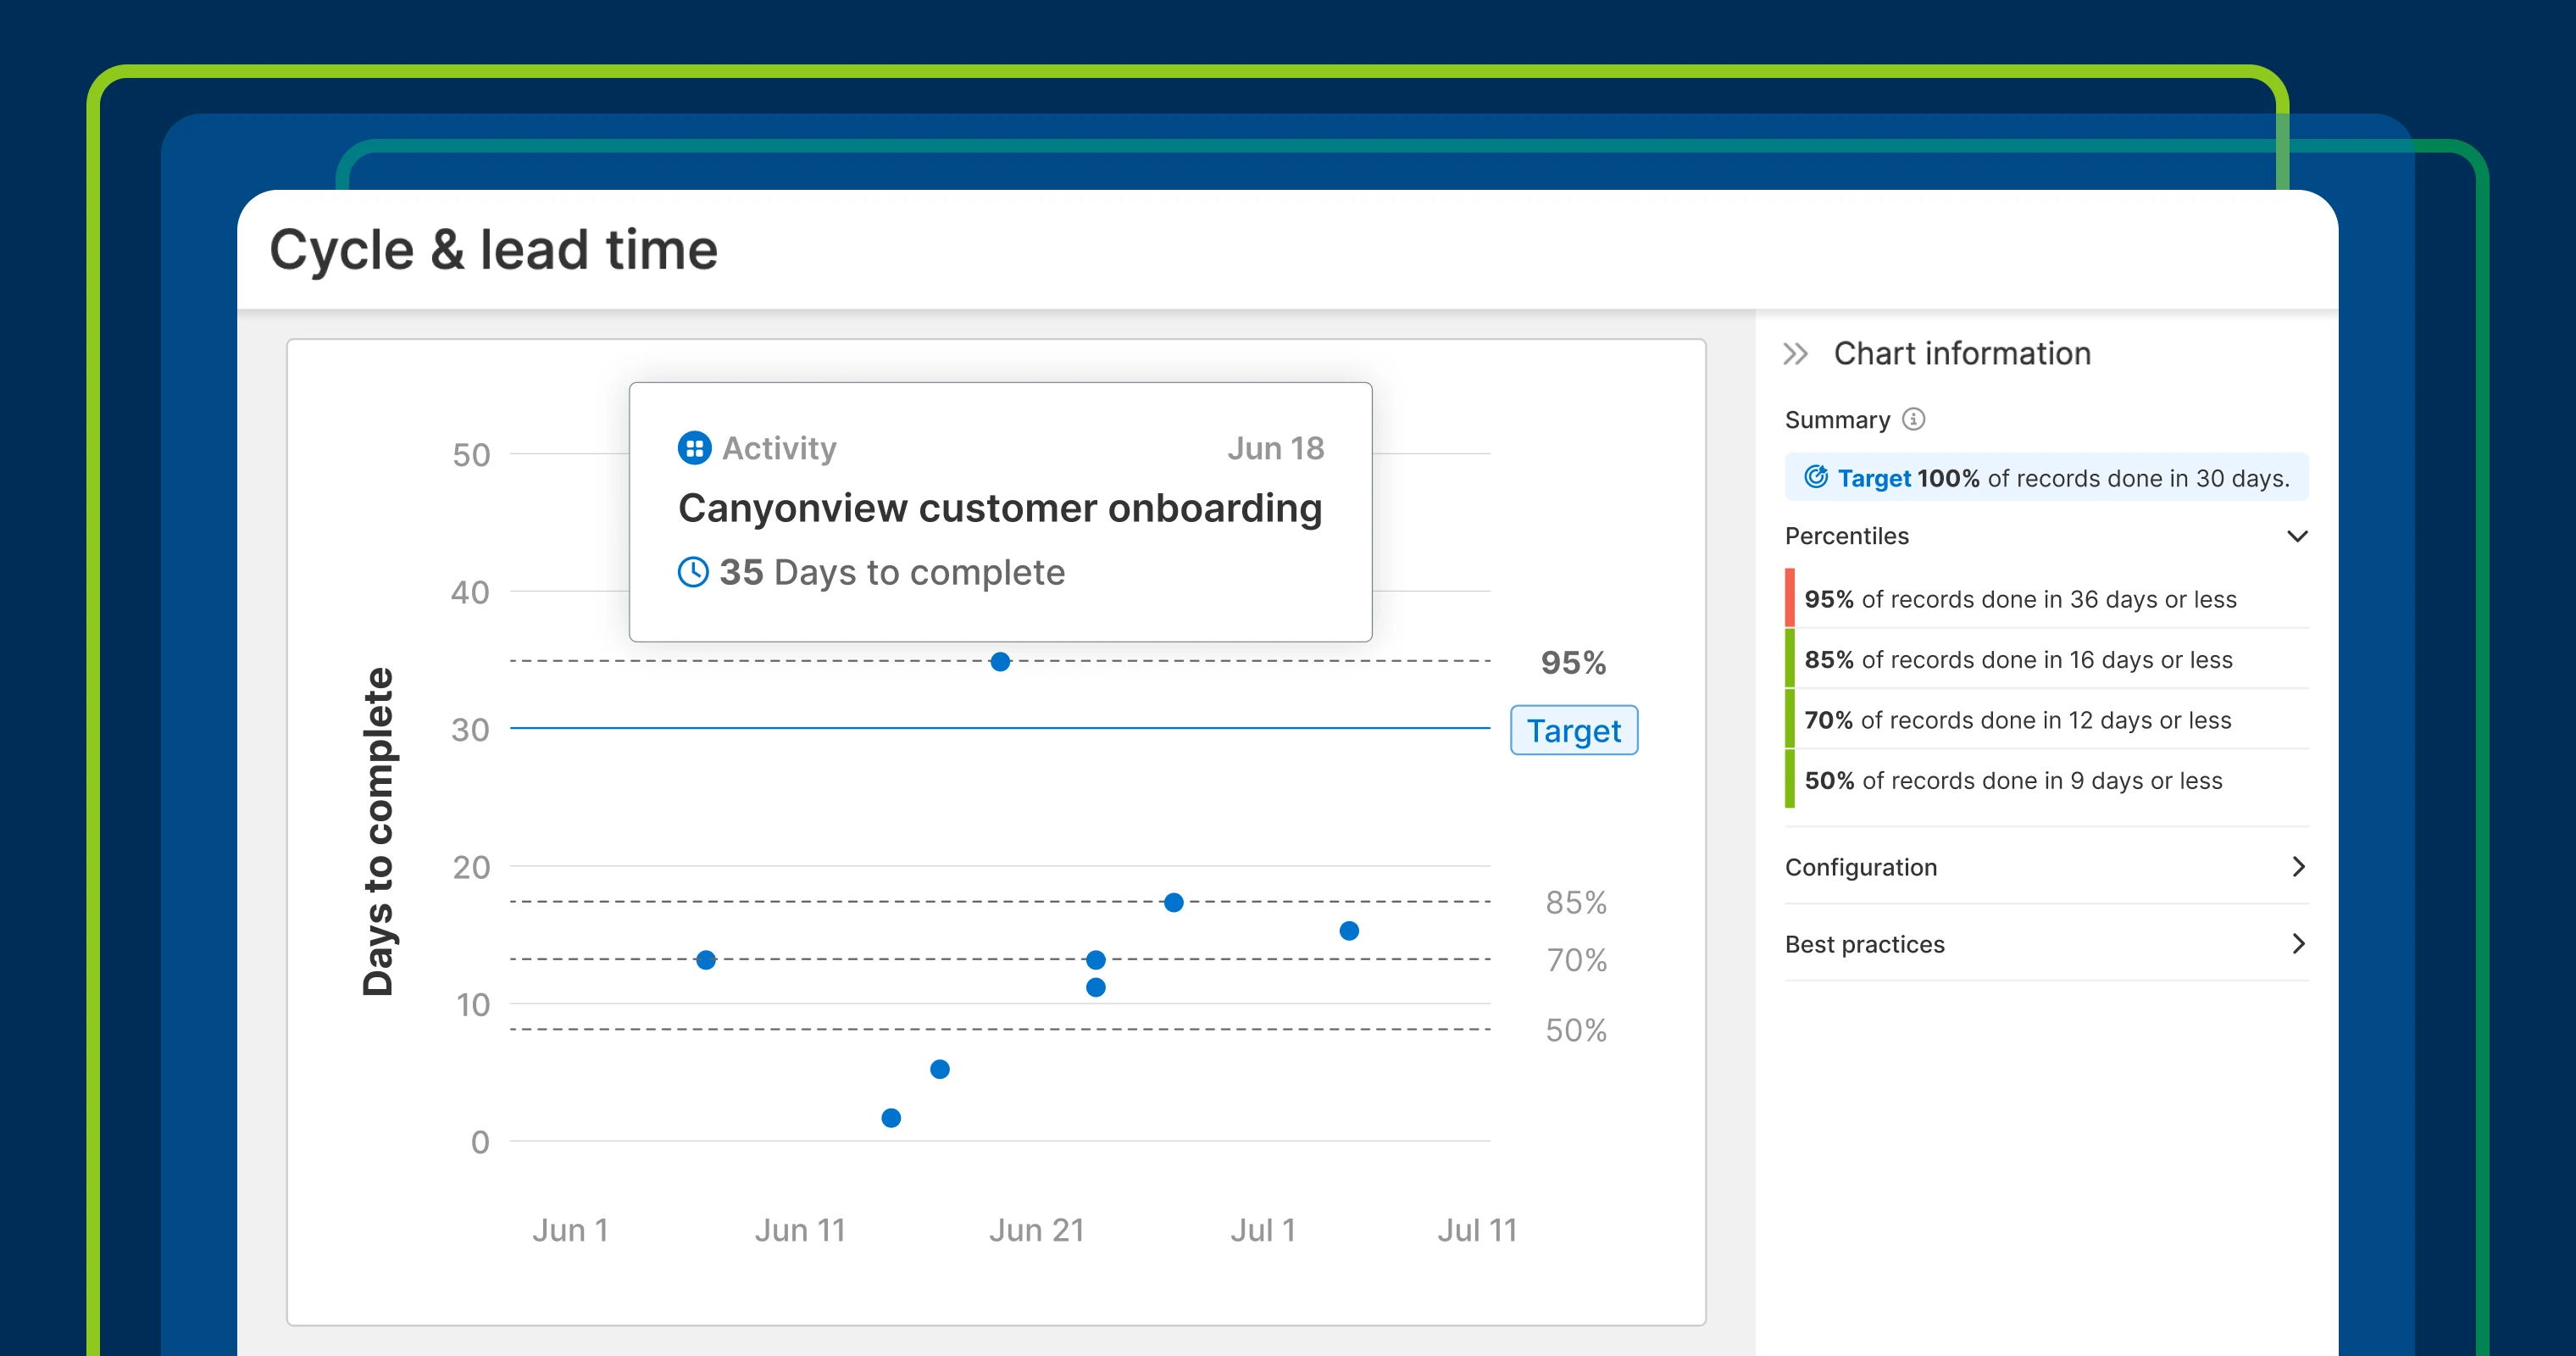
Imagine your onboarding team has a service-level agreement to complete engagements within 30 days. Add a target reference line to the lead time chart to track how many records meet your goal. In the example below, a few recent engagements exceeded the target. Clicking into any of the outliers opens a detailed view so we can understand what caused the delay (and how to improve for the future).
Understand how long work really takes so you can plan smarter and continuously improve the team's delivery speed.
Go beyond just tracking work — analyze cycle and lead time trends to deliver more predictably. Whether you use Aha! Teamwork or Aha! Develop, these insights can help you set smarter expectations and track progress over time. To unlock even more ways to deliver efficiently, be sure to explore other agile reports in your account, like the cumulative flow diagram and throughput report.
Start a free trial
The cycle and lead time report is available to Aha! Teamwork and Aha! Develop customers. Aha! Teamwork is the flexible project management tool. Complete all tasks, streamline workflows, and increase visibility. Aha! Develop helps agile development teams connect to the roadmap, optimize workload, and streamline delivery. Use Aha! Teamwork or Aha! Develop with Aha! Roadmaps to keep operations, IT, marketing, and engineering teams aligned with your overall strategy. Sign up for a free 30-day trial or join a live demo to see why more than 1 million product builders trust our software to build lovable products and be happy doing it.