Just Launched! — Understand Your Users With the Aha! + Google Analytics Integration
Editor's note: The Google Analytics integration is no longer available due to Google’s deprecation of Universal Analytics. See release note.
Just a few weeks ago, we launched an integration with Google Analytics. That is, for our customers using Aha! for Marketing. Well, product teams were instantly clamoring to use it as well. Because while most people think of Google Analytics as a tool for analyzing online traffic, it can also help you understand user behavior in web-based applications. We heard you.
Product teams can now track user engagement data from Google Analytics directly in Aha!
We originally built this integration to give Aha! for Marketing customers a way to measure the impact of digital programs and campaigns. But the ability to bring engagement metrics into Aha! from Google Analytics is useful for product teams too. You can track the impact of features and compare how different areas of your product are used over time — without ever leaving Aha!
Once the integration is enabled in your product, an engagement section appears in the drawer view of your records. This is where you add and view user data from Google Analytics. We refer to this data as “measurements” in Aha! — each measurement is based on a specific dimension in Google Analytics (such as a web page) and the metrics that matter most to you.
Note that you must be an Aha! administrator with customization permissions to integrate products with Google Analytics. Product owners and contributors can add measurements to records.
Take a look at how you can track Google Analytics data directly in Aha! to better understand your users:
Add measurements to features Create measurements to understand how users engage with pages in your application. Each measurement is based on a specific dimension, goal, and set of metrics in Google Analytics. In the example below, we are tracking the performance of a specific page in a web-based application.
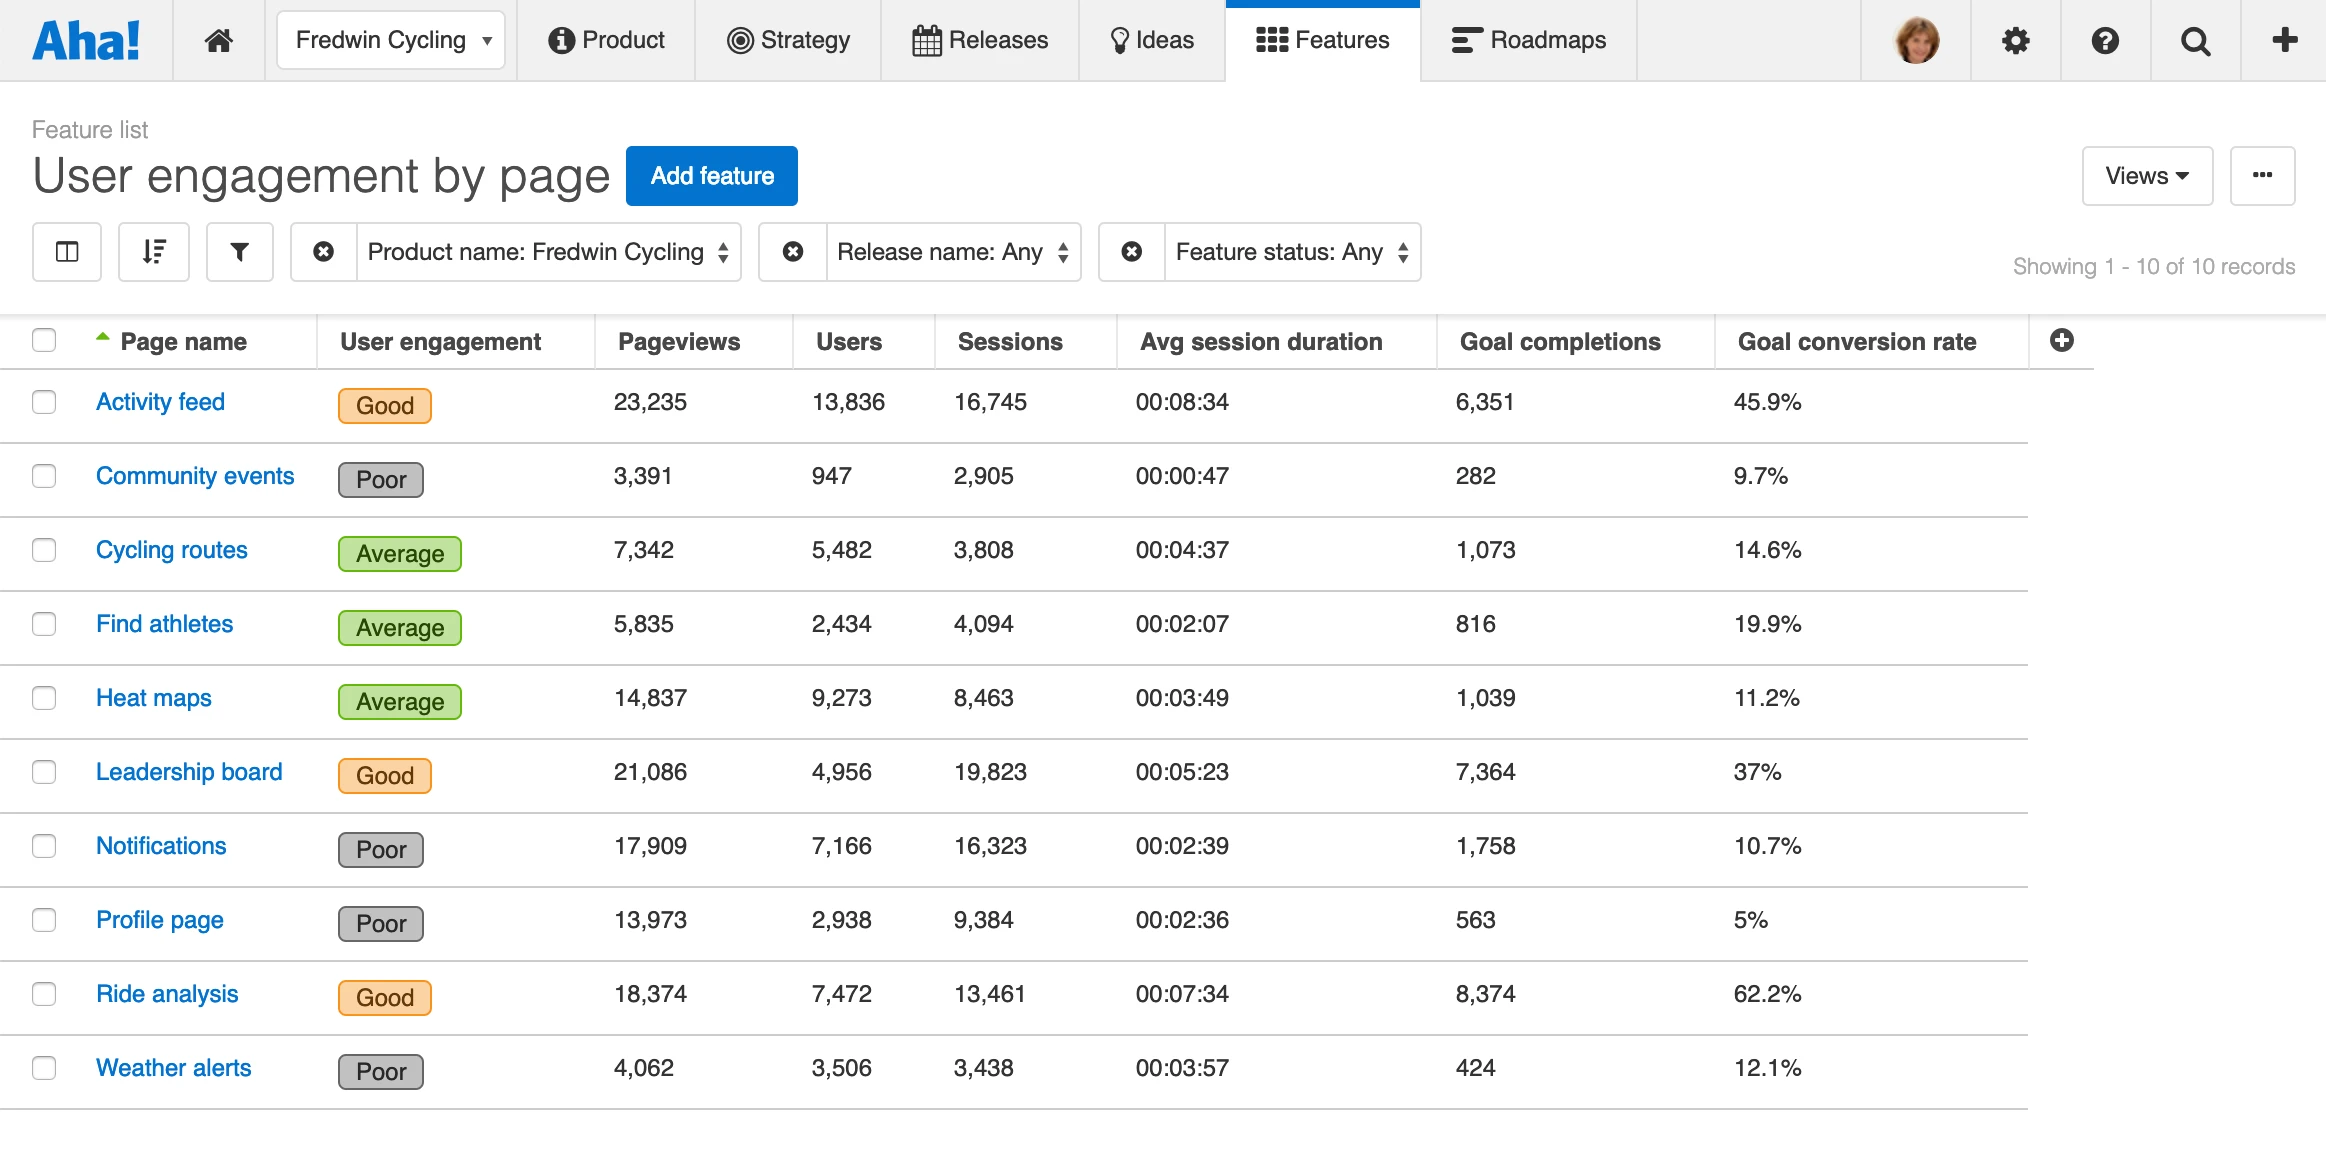
Performance metrics include pageviews, sessions, pages/session, bounce rate, average session duration, goal completions, new users, users, goal conversion rate, and goal value.
View engagement data over time Open the engagement details from your feature. You get a detailed view of up to six tracking metrics for each measurement. Choose specific date ranges or set custom time frames, such as the last 30 days. This helps you understand the performance of each page over time.
Pin the most important metric for each measurement to make it visible in the drawer view.
Report on and share results Analyze the performance of different pages to assess overall user engagement. You can include data from Google Analytics in the charts and reports you create in Aha! — in this example, we are comparing the total pageviews for each page against the goal to increase user session time.
Add your report to an Aha! notebook so you can share it with others via a PDF or secure web page.
Integrating Aha! with Google Analytics gives you the visibility to understand how people interact with your application.
So, why not get started today? Dig into the data, connect your plans to results, and make more informed roadmap decisions in the process.
Sign up for a free Aha! trial — be happy Our Google Analytics integration is available to all Aha! customers. If you are not already an Aha! customer, you may want to sign up for a free 30-day trial or join a live demo to see why more than 250,000 users trust Aha! to set brilliant strategy, capture customer ideas, create visual roadmaps, and manage breakthrough marketing programs.


