Just Launched! — The New Reports Dashboard for Product Management
You probably have tons of reports scattered around. I always had at least my product goals and their statuses, ideas submitted by customers, and features planned based on their value — all in carefully crafted spreadsheets. And I had about five different versions of my product roadmap. Now, imagine having a single, web-based dashboard for all of your product management reports. Good news! We just built that.
Today, we introduced the new reports dashboard for product managers who are looking for a simpler way to manage their products and be happy doing it.
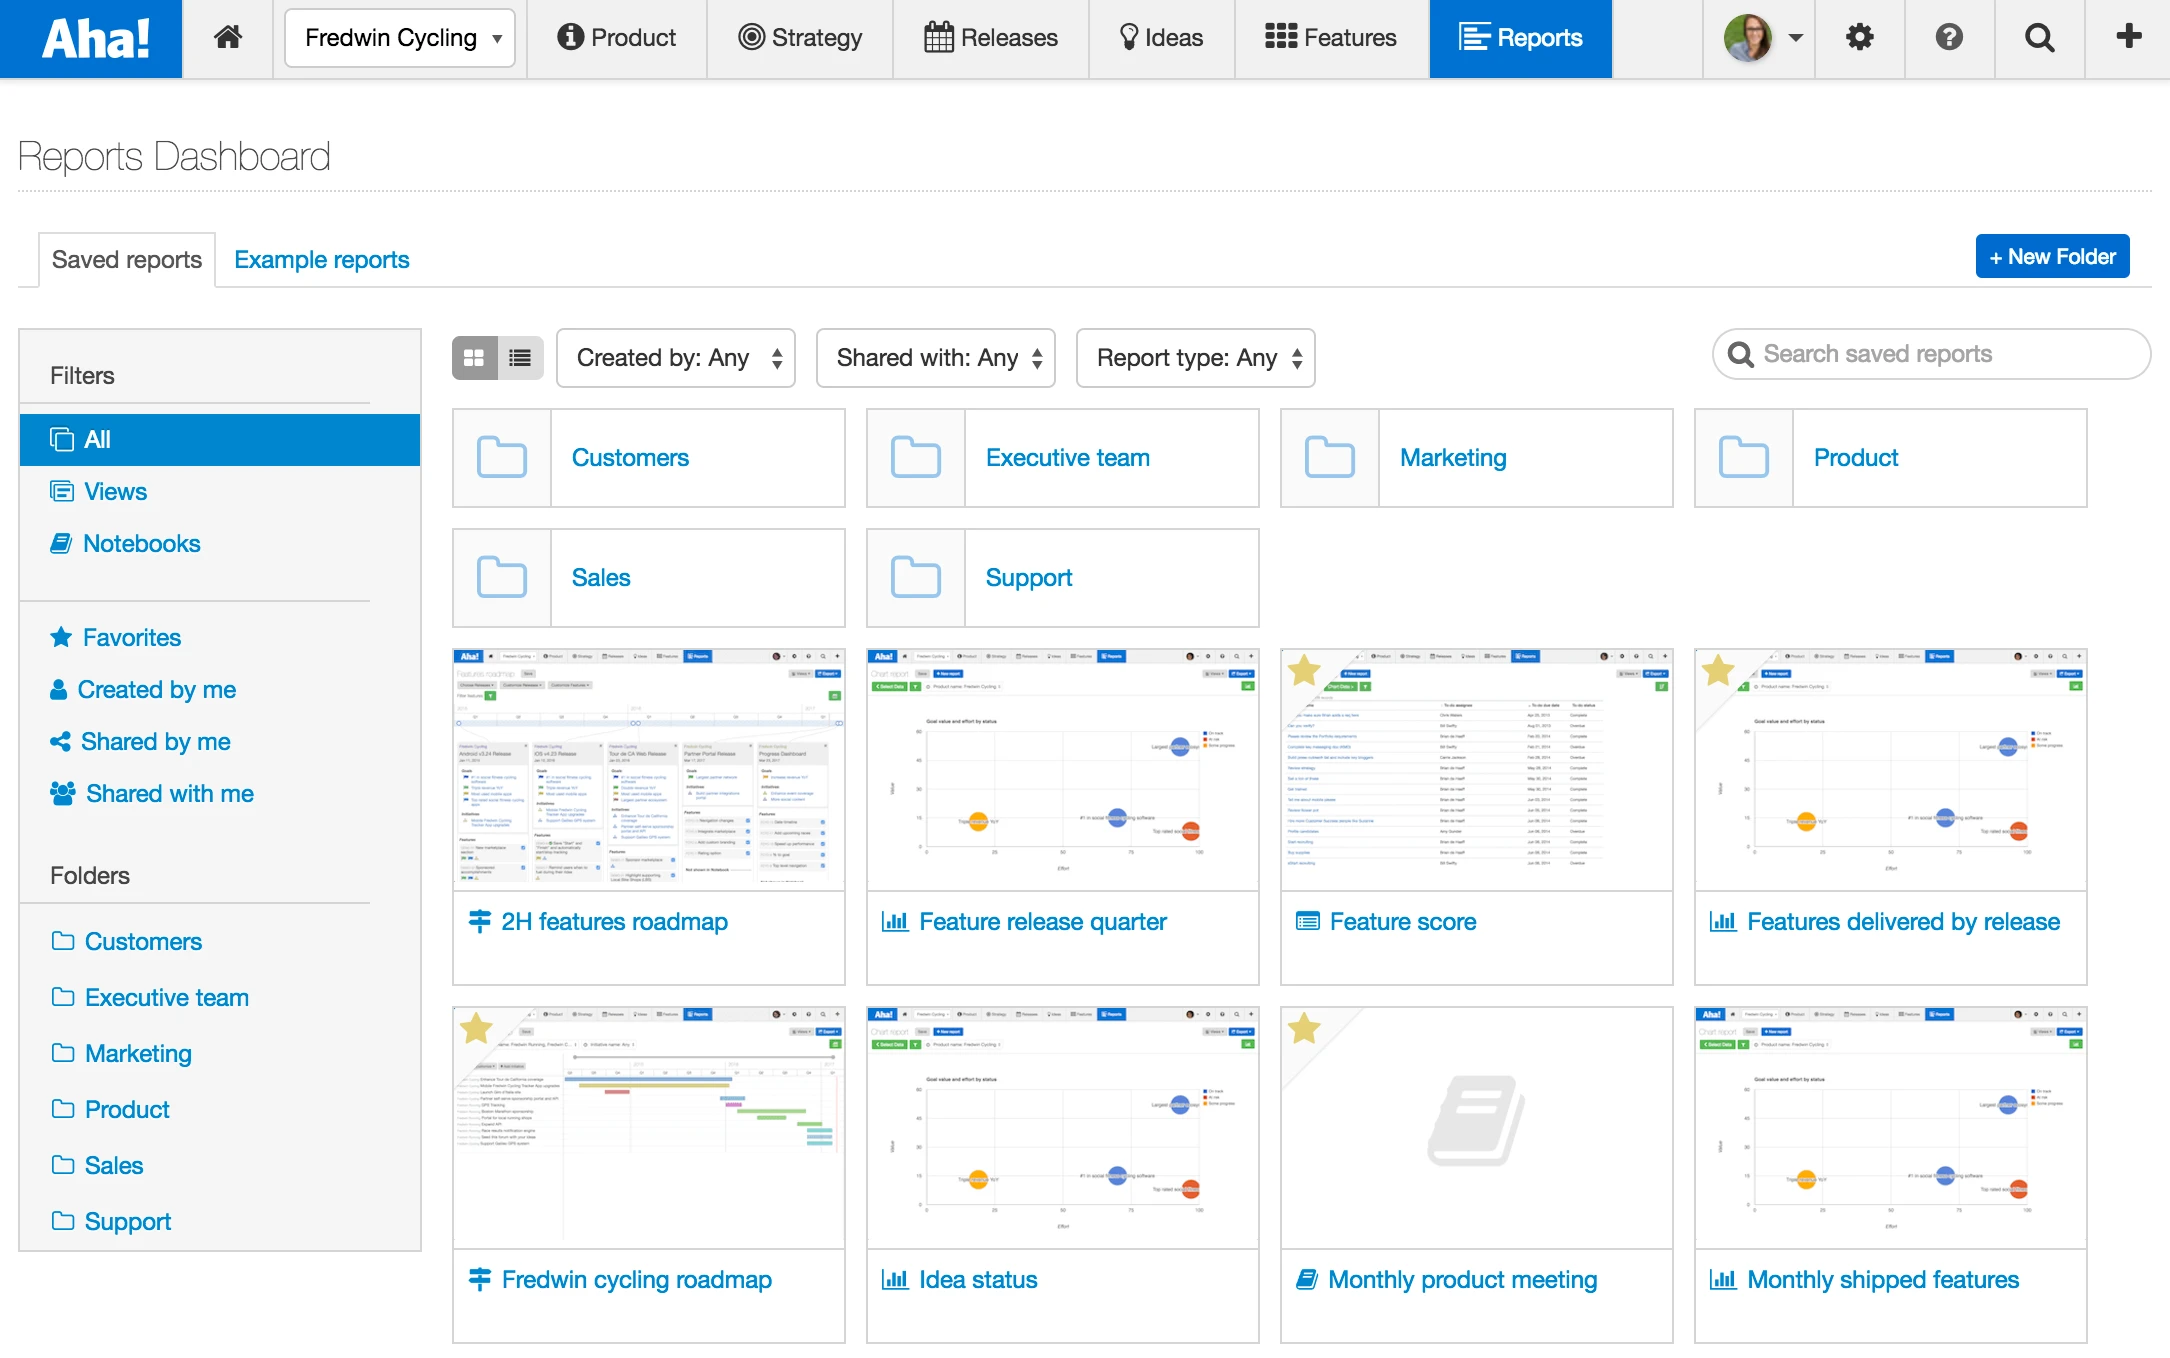
This dashboard gives you a central workspace to organize all your Aha! views, charts, and roadmaps. You can now file all of your reports into folders so you can easily organize what you have carefully crafted. We have even added the ability to search, filter, or “favorite” reports so you never waste time finding what you need. We also upgraded the example reports in Aha! with the reports we rely on most. You can access them as well through the new reports dashboard.
Here are a few ways you can start taking advantage of the new reports dashboard:
Organize your reports You can easily create folders to store your reports. Simply drag and drop a report into a folder, or select a report to open the drawer view. In the drawer view, you can edit the report’s location, sharing and editing permissions, and description. For example, you could create a folder titled “Executive team,” add relevant reports, and share with your leadership team so they can stay close to your progress.
Drag and drop reports into folders to organize them.
Instantly find your favorite reports “Favorite” your most-used reports so you can spend less time looking for roadmaps and views — and more time making better prioritization decisions. Select the star icon on each report thumbnail to add a report to your favorites list. You can also search and filter using the “Created by,” “Shared with,” and “Report type” drop-downs at the top of the page.
Viewed in a grid or list — select the list view to allow sorting on columns.
Create even more beautiful charts In addition to the new dashboard, we help you create new views and roadmaps so you spend less time building them. More than 50 Aha! report templates are now available in the Example Reports tab. Below, we selected an example report to instantly create a chart visualizing the status of current ideas in the backlog.
Start from scratch or use one of the 50+ report templates provided.
Share Aha! Notebooks What good is a beautiful roadmap if no one can see it? Add reports to a notebook to share via secure web page or PDF. For example, you can provide greater product visibility to your customers by creating and sharing quarterly roadmap presentations.
Notebooks are now organized in the new reports dashboard.
Aha! gives you a single place to develop your product strategy, goals, and initiatives — carefully tying them to the day-to-day work that gets done.
And, with our latest update, you can spend less time building and organizing reports and more time getting all that work done.
Sign up for a free Aha! trial — be happy The reports dashboard is available to all Aha! customers. If you are not already an Aha! customer, you may want to sign up for a free 30-day trial to see why over 100,000 users trust Aha! to set product strategy, create visual roadmaps, and prioritize releases and features.


