See how much time delivery work takes at every stage of your workflow.
New workflow heatmap in Aha! Teamwork and Aha! Develop


Work slows down in surprising places. Handoffs stretch longer than expected. Reviews wait on busy teammates. For project and engineering leaders, understanding where flow slows and why is essential to helping the team be more efficient. But without a clear view of your workflow, you are left guessing why the team is not delivering.
The new workflow heatmap shows exactly how long work takes at each stage — grouped by team, type, or sprint — so you see what causes delays.
Know where work slows
You already have access to agile reports in Aha! Teamwork and Aha! Develop to help you analyze workflows in different ways. For example, the cumulative flow diagram shows you when work starts piling up in certain statuses. The cycle and lead time report tracks whether you are completing work faster or slower over time. Both are useful for spotting that something is off.
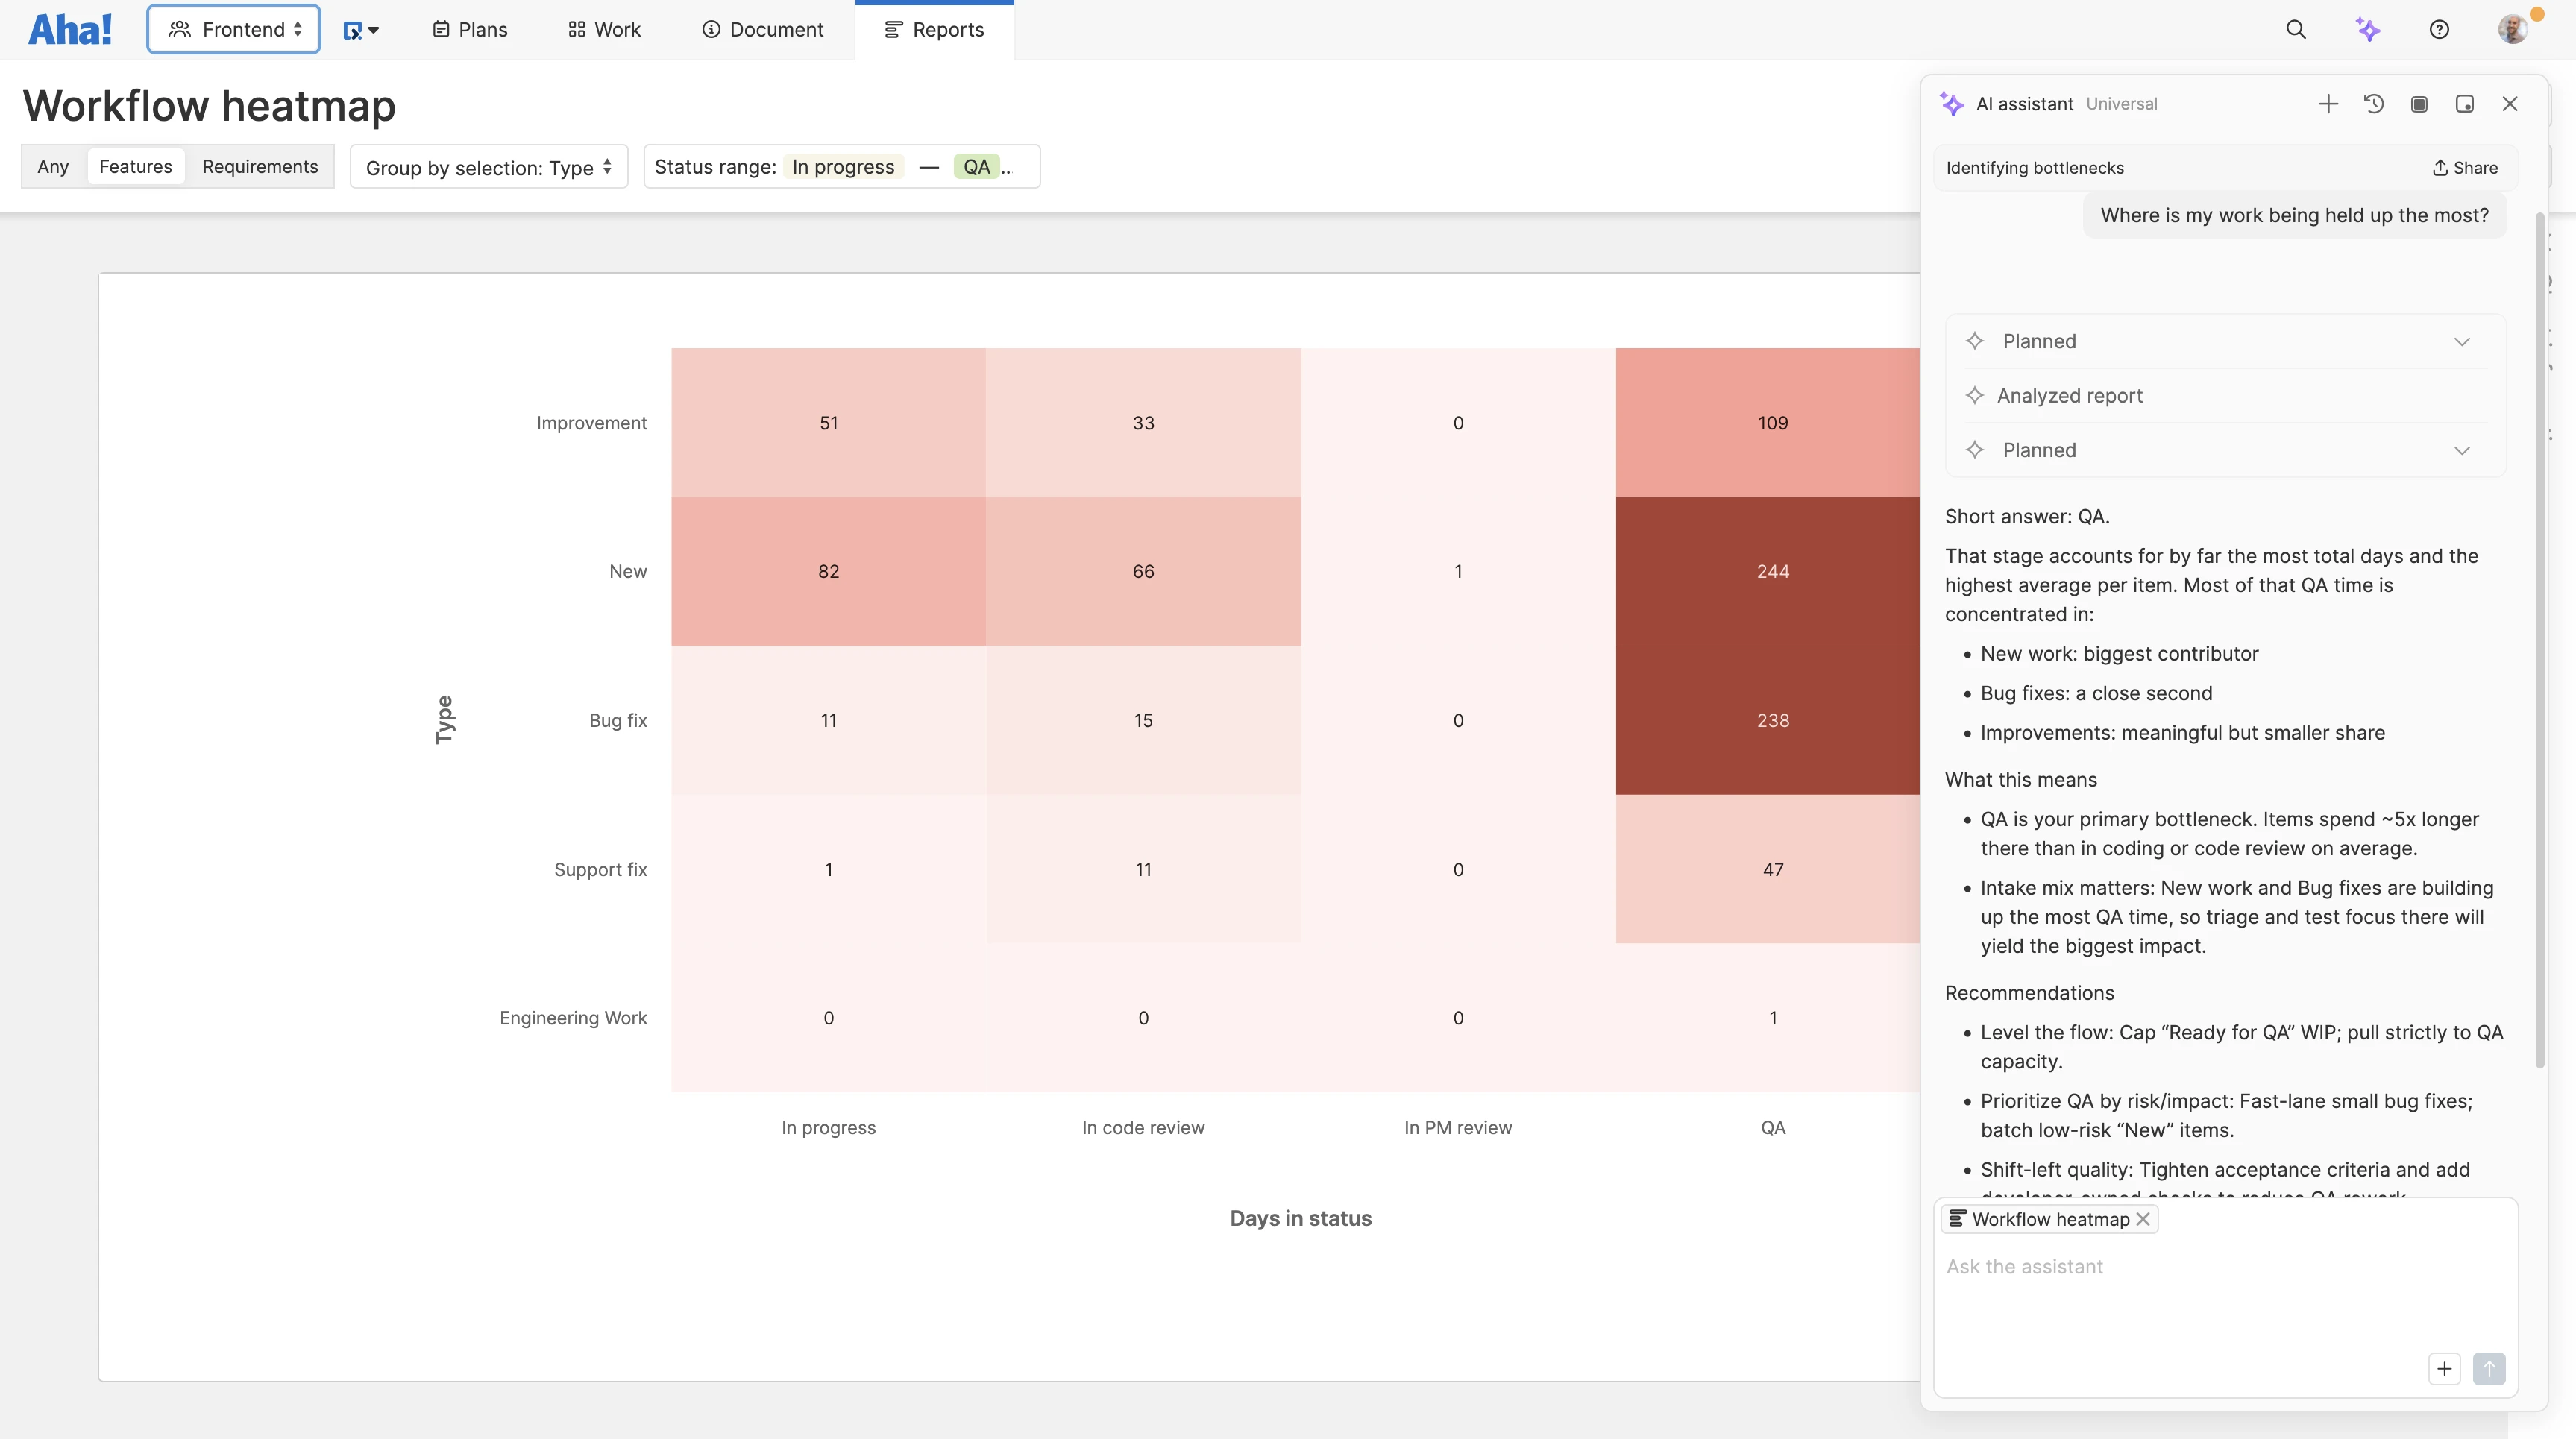
The new workflow heatmap helps you figure out why. It reveals how long work sits at each individual stage — shaded based on how many days were spent there. (Darker shading means more time, lighter means less.) Now, you can see exactly where bottlenecks happen and dig into the cause.
Here is what you can do:
Pinpoint slowdowns: Spot where work spends the most time in your workflow.
Analyze patterns: Group work by type, team, sprint, and more to isolate what drives delays.
Drill into details: Click any cell to view a list of contributing records and uncover the cause.
Measure performance improvements: Validate whether process changes successfully reduced bottlenecks.
Workflow heatmaps are now available in Aha! Teamwork Advanced and Aha! Develop Advanced. Use these delivery-focused tools alongside Aha! Roadmaps to create a unified product development environment. Schedule a demo to learn more.
Here is Amy Ellis from our product team with a closer look:
How to get started
Go to Reports Workflow heatmap.
Set the time frame and status range you want to analyze.
Filter by record type to focus on features, requirements, or both.
Choose to group records by type, team, sprint, estimate, and more.
Analyze the data; each cell shows how many days records spent in that workflow stage.
Click on a cell to see which records spent time in that workflow step, and identify the root cause of delays.
📚 For more details, read the full support article.
The workflow heatmap joins the cumulative flow diagram and cycle and lead time report to give you three complementary views of your delivery process. Together, they help you understand not just that work is slow, but why — and what to do about it.
Start a free trial
The workflow heatmap is available for Aha! Teamwork and Aha! Develop customers. Aha! Teamwork is the flexible project management tool. Complete all tasks, streamline workflows, and increase visibility. Aha! Develop helps agile development teams connect to the roadmap, optimize workload, and streamline delivery. Use Aha! Teamwork or Aha! Develop with Aha! Roadmaps to keep operations, IT, marketing, and engineering teams aligned with your overall strategy. Sign up for a free 30-day trial or join a live demo to see why more than 1 million product builders trust our software to build lovable products and be happy doing it.