Just Launched! — Report on How Many Features Your Product Team Shipped
Reports in Aha! are powerful. You can use them to easily report on and analyze everything product management. This gives you access to information which helps you better understand everything you do and provides key information to help you prioritize the most important features into your roadmap.
You already had the ability to create custom ad-hoc reports to answer any question. You could save views and share them with the team (via Notebooks). And today we’ve improved reports even further.
We have done this by launching new enhanced pivot tables that now support calculations including sum, average, minimum and maximum functions. This gives you the ability to quantify and report on everything in Aha! (including what your team has shipped).
It’s good to be able to quantify what you have done and why you have done it.
You can now leverage reports to perform calculations across rows and down columns (including total, average, minimum, maximum, count). And to make analyzing the data even easier, pivot tables in Aha! now include the ability to show row and column headers.
Let’s start with how to do that first — show headers on pivot table reports. Click the Customize View button on the pivot table page to select whether row/column headers should be shown.
The Customize View screen with configuration options is shown above. Check the box beside each option to show column or row headings.
Ok, so now let’s highlight the bigger enhancement — the ability to perform calculations on the data objects in your report. To enable calculations, click the Select data button to select the type of data to show in your table. Make a selection in the cells section to determine how the data should appear within the cells first.
Second, if the data can be calculated across rows or down columns, the Calculate section will appear at the bottom. This will allow you to make calculations based on totals, averages, counts, minimum and maximum across rows and down columns.
The Select data screen with configuration options is shown above with data being summed within cells and averaged across rows and down columns.
Contributors and Product owners can both create reports using these new customizations. And once they are done, anyone in Aha! including Reviewers and Viewers can view the reports if they are shared.
Here are a few example reports you can now create:
Example reports dropdown menu We have expanded the number of Example Reports to help you get going. Obviously, for some of the more advanced use cases you need to enter the data (like scores on your features) to get the same types of results that you see below.
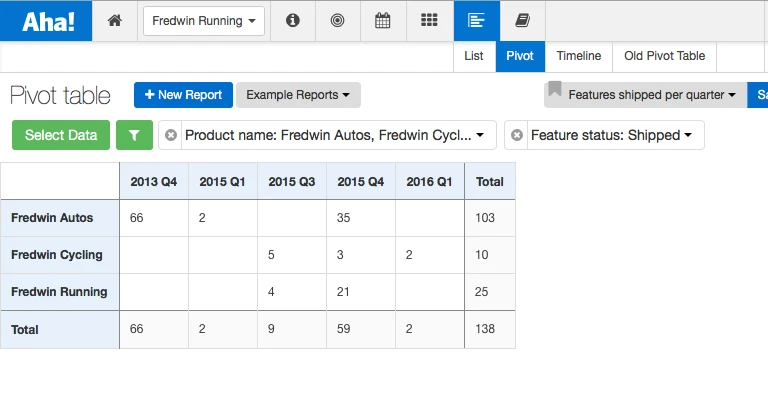
Features shipped per quarter Use the Sum option to total items in rows or columns. For example, you could total the amount of features shipped in a given time frame (as referenced in the title of this article :-)). By adding up the features shipped per quarter you can easily gauge productivity and output for the team.
Average score of a set of features Use the Average option to determine the average of a set of data points. For example, if you wanted to determine the average score of a group of features. This would allow you to compare a set of features in one report against the average score of features in past reports to provide insight into how they compare.
The example report above shows average feature scores using scorecard metrics.
Potential revenue impact on features There is a cost to deliver new features. By using the Sum option combined with custom fields, you can measure the revenue impact on those features. This allows you to measure the revenue compared to the cost to develop those features.
The example report above shows a sum of custom fields totaled by row and column.
Aha! gives you the reporting features you need to analyze what’s happening, without spending hours of time duplicating data and manipulating spreadsheets. We like that and think you will too.
Sign up for a free Aha! trial — be happy Enhanced pivot tables are available for all Aha! customers. If you are not already an Aha! customer, you may want to sign up for a free 30 day trial now. See why over 30,000 users trust Aha! to set product strategy, create visual roadmaps, prioritize features, and capture ideas.


